Where Your SIEM Budget Actually Goes: The 10 Patterns Behind SIEM Cost
SIEM cost keeps rising because nothing ties what you ingest to what you need to catch. Here are the 10 patterns behind the bill, and how to reduce SIEM costs without replacing anything.


SIEM cost goes up at almost every renewal, and when the security program isn't delivering what it should, the SIEM usually takes the blame. It's the biggest line item, it's painful to run, and it isn't obviously tied to any outcome.
But the SIEM isn't the problem. The gap between it and your SecOps program is. In most programs, nothing ties what you pay to ingest to what you need to catch. So everything goes in, nobody audits it, and every new threat brings new logs. The bill only goes one way.
This guide is the audit nobody had time to run. It covers how SIEMs are priced, the 10 patterns that account for most of the data nobody uses, and how to reduce SIEM costs in the SIEM you already run.
How much does a SIEM cost, and what drives it?
Almost every SIEM bill comes down to one variable: how much data you send it. The pricing models differ, but each one meters volume, and none of them meters whether the data is used.
| SIEM | What it meters | Published list price? |
|---|---|---|
| Splunk | GB ingested per day, or workload (compute and storage for search) | No, priced by quote |
| Microsoft Sentinel | GB ingested into the analytics tier (pay-as-you-go or daily commitment tiers), plus a lower-cost data lake tier | Rates are in the Azure pricing calculator |
| Google SecOps | Ingestion volume, against a committed credit | No, priced by quote |
| Elastic Security | GB ingested and GB retained (serverless) | Yes |
| CrowdStrike Falcon Next-Gen SIEM | Daily third-party ingest, with a free allowance for Falcon Insight customers | No, priced by quote |
Licence is only part of the cost. Every GB also has to be shipped, parsed, stored and searched, and somebody has to run the pipeline. So "how much does a SIEM cost?" is really "how much data are you sending it, and why?"
Why nobody knows where the money goes
In most programs, two groups touch the SIEM and neither owns the whole picture. One onboards data sources and pays for ingest. The other is expected to catch the threats that matter. Nothing connects the two, so nobody can say which data is earning its place.
The default answer is to collect everything, in case it's needed. New cloud service? Send its logs. New threat in the news? Add the source that might show it. Nobody goes back to check what's being read.
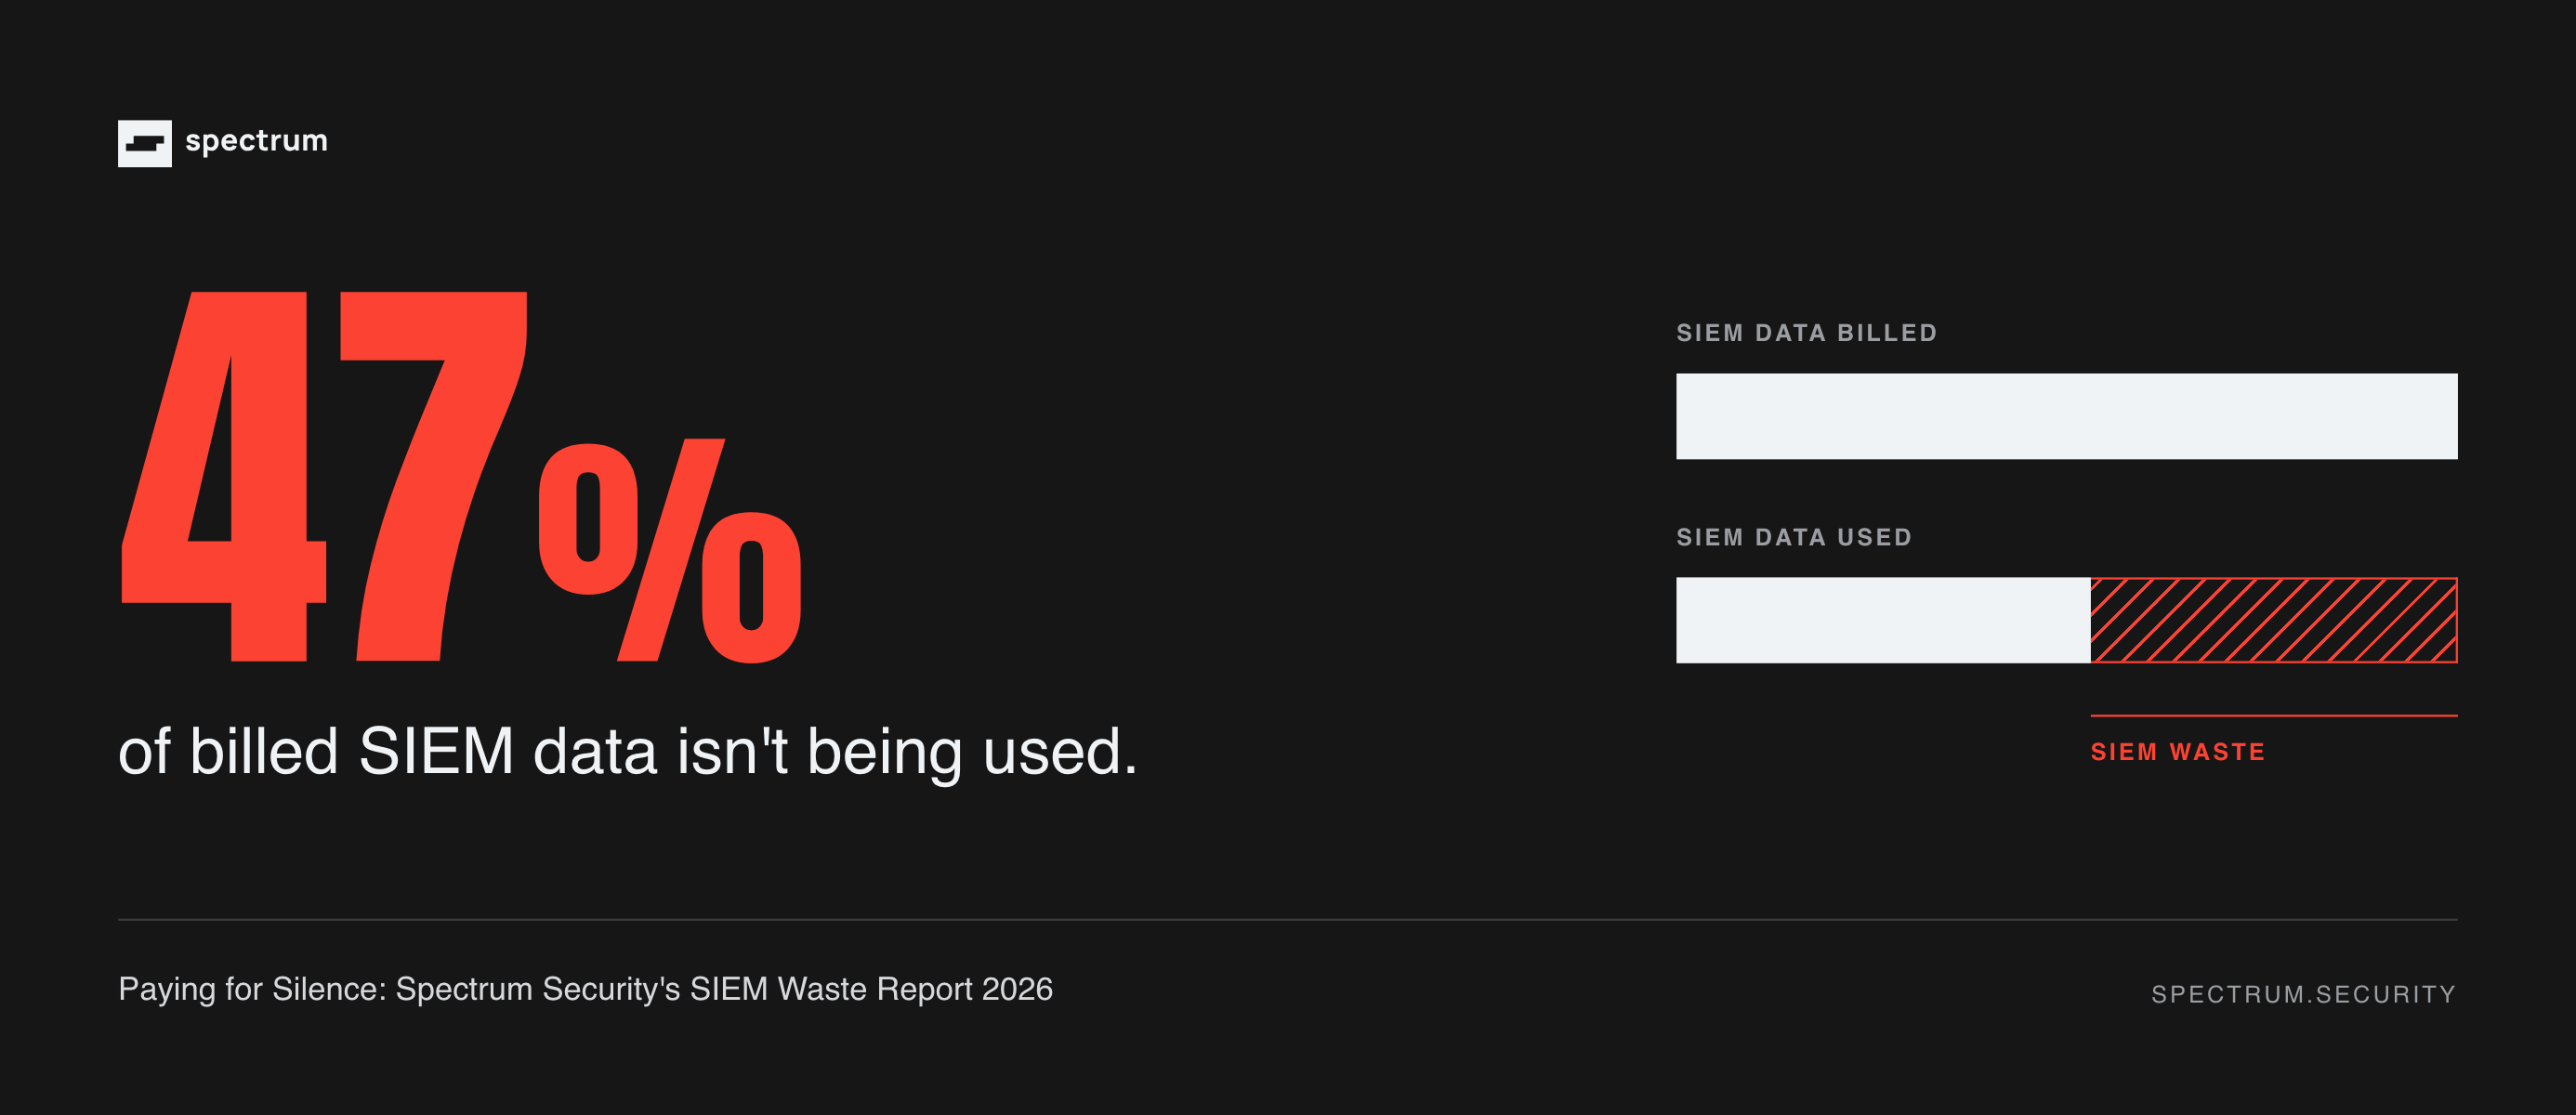
When we measured it, the result was consistent. In Paying for Silence: SIEM Waste Report 2026, Spectrum's Delta research team checked every event class in live customer SIEMs against every enabled detection, saved search and dashboard. In the median environment, 47% of billed ingest was read by nothing and held no investigative value the environment didn't already keep elsewhere. That held across Splunk, Microsoft Sentinel, Google SecOps and CrowdStrike, and across small and very large estates.
The waste wasn't random, either. The same ten patterns showed up again and again.
The 10 SIEM waste patterns
Ranked by average share of daily ingest across the estates we measured. (The averages describe how big each pattern tends to be; they aren't slices of the 47%.)
| # | Pattern | Avg share of daily ingest | Where the fix usually lives |
|---|---|---|---|
| 1 | Machine-to-machine API calls in cloud audit trails | 16.6% | Source (audit config) |
| 2 | Heartbeats, health probes and polling loops | 8.5% | Pipeline |
| 3 | Ops telemetry that never belonged in a SIEM | 6.0% | Pipeline (route elsewhere) |
| 4 | Repeated errors nobody fixed | 4.3% | Source (fix the error) |
| 5 | Endpoints maintaining themselves | 3.7% | Pipeline |
| 6 | The same events, ingested twice | 2.6% | Connector config |
| 7 | Both halves of every event | 2.5% | Pipeline |
| 8 | Kubernetes auditing itself | 2.1% | Source (audit policy) |
| 9 | Fields nobody reads | 1.6% | Pipeline (transform) |
| 10 | Broken feeds, still billed | 1.0% | Source or parser |
1. Machine-to-machine API calls in cloud audit trails
What it looks like: query engines reading data lakes, queues polling, encryption services minting keys. Software calling software, under expected roles, that no detection looks at. It was the largest pattern by far, and in the worst estates it reached a third of daily ingest.
The fix: filter at the source. AWS CloudTrail's advanced event selectors exist to help you "control costs by only logging the specific data events of interest." For Google Cloud logs, Google recommends filtering at the source with Cloud Logging export filters. Check first: keep the human and unexpected-role activity; that's what your detections and investigations need.
2. Heartbeats, health probes and polling loops
What it looks like: software proving it's alive, once a second, on every host. It showed up in every estate we measured.
The fix: drop it in the pipeline before it reaches the SIEM, for example with the OpenTelemetry Collector filter processor or a filter in your syslog forwarder. Check first: if anything alerts on a host going silent, keep a summarized signal rather than every beat.
3. Ops telemetry that never belonged in a SIEM
What it looks like: metrics, application logs, and log shippers logging themselves, routed to security because the SIEM was the only pipe available.
The fix: route it to your observability stack or to cheaper storage. Microsoft Sentinel's split transformation sends data that doesn't match a rule to the data lake tier only; Splunk's ingest actions can route or filter it before it's indexed.
4. Repeated errors nobody fixed
What it looks like: the same failure, logged over and over. In one Google SecOps estate, dozens of monitoring roles were missing a single read permission and retried it continuously, about 873,000 access denials an hour. In one Sentinel estate, one internal host hit one server 711 times a second for two weeks. A volume-anomaly detection was enabled the whole time. It never fired.
The fix: fix the cause, not the log itself: a permission or a firewall rule, for example. These defects are burying the failures you'd actually want to see.
5. Endpoints maintaining themselves
What it looks like: EDR faithfully recording patchers, updaters and browser caches doing their jobs.
The fix: filter known-good maintenance activity in the pipeline, by process and path, before it's billed. Check first: filter on specific, signed maintenance processes, not whole directories that an attacker could use.
6. The same events, ingested twice
What it looks like: two connectors, two products, two tables, two bills. Common after a tool change or an acquisition, when an old integration was never switched off.
The fix: pick one copy, repoint anything that reads the other, then switch it off.
7. Both halves of every event
What it looks like: start and end, logon and logoff, query and response. Investigations almost always use one half.
The fix: keep the half your detections and analysts use and drop the other in the pipeline. For Windows, start from Microsoft's audit policy recommendations rather than auditing everything.
8. Kubernetes auditing itself
What it looks like: controllers reconciling status and renewing leases, all day, in every cluster.
The fix: set the audit policy at the source. Kubernetes supports four audit
levels (None, Metadata, Request,
RequestResponse), and rules with level None skip logging for routine system traffic. Check
first: keep full detail for changes to secrets, roles and workloads.
9. Fields nobody reads
What it looks like: large policy arrays and duplicated metadata, carried on every event.
The fix: strip the fields in the pipeline. Google SecOps transform processors can remove verbose fields, and most pipelines can do the same.
10. Broken feeds, still billed
What it looks like: unparseable, blank or misrouted events, metered like the real thing.
The fix: fix the parser or the source, and monitor for it. A broken feed is also a coverage problem: any detection that relies on it can't fire.
Will cutting data break detection?
This is the reasonable fear, so we checked every recommended cut against every enabled detection. About 3 in 100 cuts needed a detection repointed first. The rest either touched nothing or thinned out a detection that was reading a whole table when it didn't need to.
Most fixes don't touch the SIEM at all. Roughly 7 in 10 live in the shipper or pipeline, about a quarter at the source, and about 1 in 20 inside the SIEM. Fixing upstream also cuts transport and pipeline cost, which a SIEM-side filter doesn't.
The audit also finds the other side of the gap. Reconciling ingest against detections surfaced detections that could never fire: Kubernetes rules seeing a fraction of the audit stream, firewall detections written for vendors whose logs never arrived, a threat feed that had quietly gone dead. Cost work and coverage work turn out to be the same work. The Detection Debt Report 2026 goes deeper on that.
How to reduce SIEM costs without replacing your SIEM
Five steps, in order:
- Get the meter. Pull daily billed ingest by source from the SIEM's own usage data, not estimates. Raw-byte estimates were up to 2.3x off the meter in our data, in both directions. Measure two weeks so burst days show up.
- Map every source to a reader. For each event class, list the enabled detections, saved searches and dashboards that read it. Anything with no reader is a candidate.
- Ask the investigation question. Would an analyst need this in an incident, and is it already held somewhere else? Keep what matters. Cut or tier the rest.
- Fix the top five first. Rank by cost. Use your platform's native controls: Sentinel filter and split transformations, Splunk ingest actions and Edge Processor, Google SecOps filter processors, the Elastic drop processor, or the source-side settings above.
- Make it continuous. Ingest drifts every month. Reconcile what you collect against what you use on a schedule, and alert when a source floods or goes silent.
Want a rough number first? The ROI calculator estimates your annual waste from your daily ingest in under a minute.
Close the gap, and watch your bill drop
Switching platforms can lower the price per GB. It doesn't lower the GBs. These patterns showed up across every SIEM we measured, and they'd follow you through a 6-to-12-month-plus migration. (More on that in Save your SIEM: why switching won't fix what's wrong.)
The lasting fix is to connect what you ingest to what you need to catch, and keep it connected. That's what Spectrum does in the SIEM you already run. It ties every source to the detections and investigations that use it, checks every cut against coverage before it's made, and puts the spend nothing was using toward new coverage, building and tuning detections so it keeps up with new threats without adding hours to your team. Better coverage for less spend, without replacing anything. See how it works.
Before you renew or replace, get a SIEM Second Opinion. We'll show you where the gap is in your program and what to fix first.
FAQ
How much does a SIEM cost?
It depends mostly on how much data you send it. Most SIEMs price by GB ingested per day, a committed daily volume, or the compute used to search. Only some vendors publish list prices. Licence is only part of it: shipping, storing and running the pipeline add to the total.
Why is my SIEM so expensive?
Usually because nothing ties what you ingest to what you need to catch, so data goes in by default and nobody audits it. In the SIEM Waste Report 2026, 47% of billed ingest in the median environment was read by nothing.
How do you reduce SIEM costs?
Measure ingest by source from the SIEM's own meter, map every source to the detections and searches that read it, cut or tier what nothing uses, fix the five largest items first, and repeat on a schedule. Most fixes live in the pipeline or at the source.
Will switching SIEMs lower my costs?
It can lower the rate you pay per GB, but not the volume. The same waste patterns appeared across every platform we measured, so unused data moves with you unless you fix it first.
Does reducing SIEM data hurt detection?
Rarely, if you check each cut against coverage first. About 3 in 100 recommended cuts needed a detection repointed before the data was removed.